Tax revenue maps typically report the overall tax levy on a property in dollars. This approach favours large format developments but hides how efficiently it’s generating municipal revenues. Efficiency matters!
We know that the cost of most city services scale with distance. The cost of roads, transit, sidewalks, snow clearing, etc… increase the more spread out we are. So shouldn’t the city consider the revenue per hectare of a development instead, to ensure the services it provides to those residents are sustainably funded?
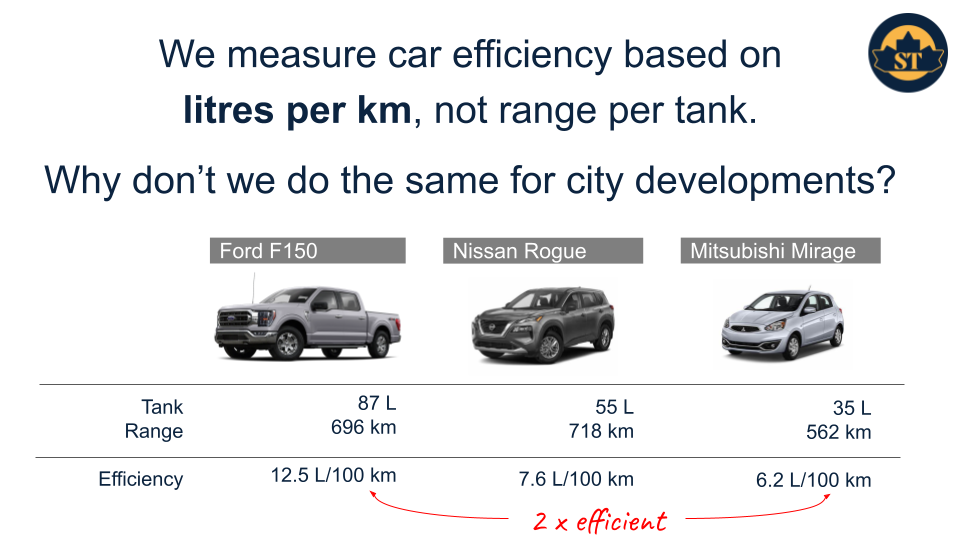
This is what we refer to as “tax revenue density”. You divide the amount of tax a property generates by its area. At scale, this type of metric is useful to show development patterns that are efficient at building wealth for the city, and which are less productive. The same way we can compare fuel efficiency of cars, dividing the tax bill by area permits apples-to-apples comparisons between properties. Large format properties are no longer favoured just because they are big.
Efficient land use has been a cornerstone principle of Strong Towns and firms like Urban 3 have been successful in generating stunning city renderings that show where a city is generating wealth efficiently in intuitive ways.
Ottawa’s Revenue Density
The City of Ottawa recently launched an online property tax lookup tool. Paired with the list of all city addresses, available through Open Ottawa, we were able to put together and visualize most of the 400,000 city addresses and collect tax information for years 2023 and 2024.
The data is surprisingly comprehensive. When all the property taxes are compared to the city’s official Taxes by Ward 2022-2024, the data is 94% accurate. Coverage by zoning groups is also very good with over 97% of Part 6 - Residential, and 84% of Part 10 - Mixed-Use / Commercial properties successfully found.
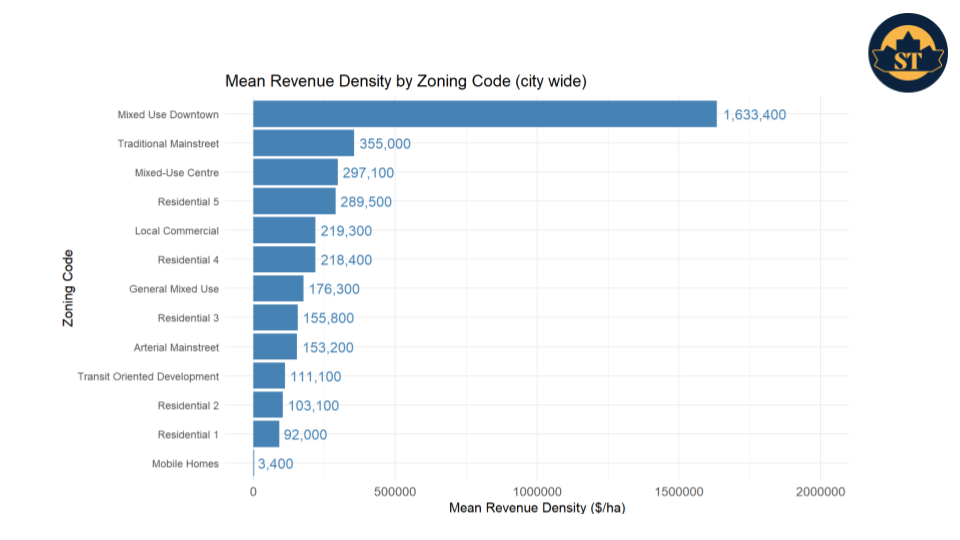
When we look at the city-wide average revenue density by zoning group we see how efficient Mixed-Use Downtown properties are. At the bottom, we find R1, R2, Arterial Mainstreet and oddly Transit Oriented Development (maybe it just needs more time? We’ll look at this in a future post).
Comparing Properties
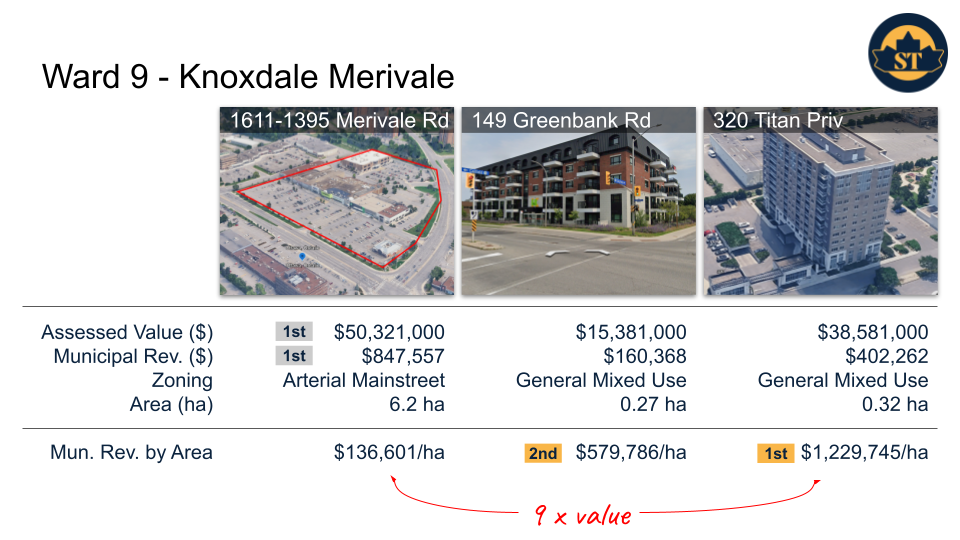
In Ward 9 Knoxdale-Merivale, the property with the highest assessed value is a huge lot with multiple big box stores, a fast-food restaurant, and a gym. This property also pays the highest amount of municipal taxes. However, when you account for how much space it takes up, mostly for parking, it generates slightly over $130,000 per hectare. By comparison, the two most efficient revenue generating properties in the ward generate municipal revenues up to 9 times more efficiently, and people live there!
Citywide 3D maps
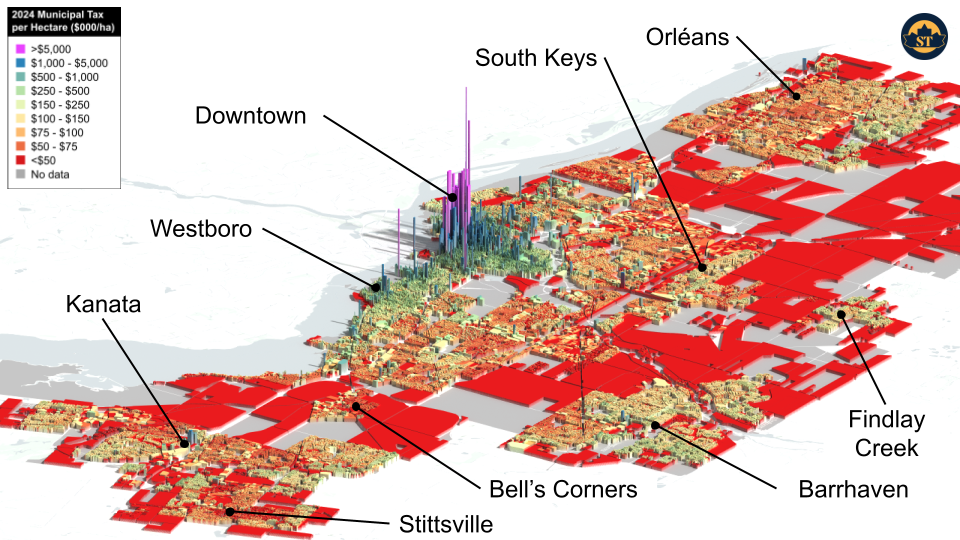
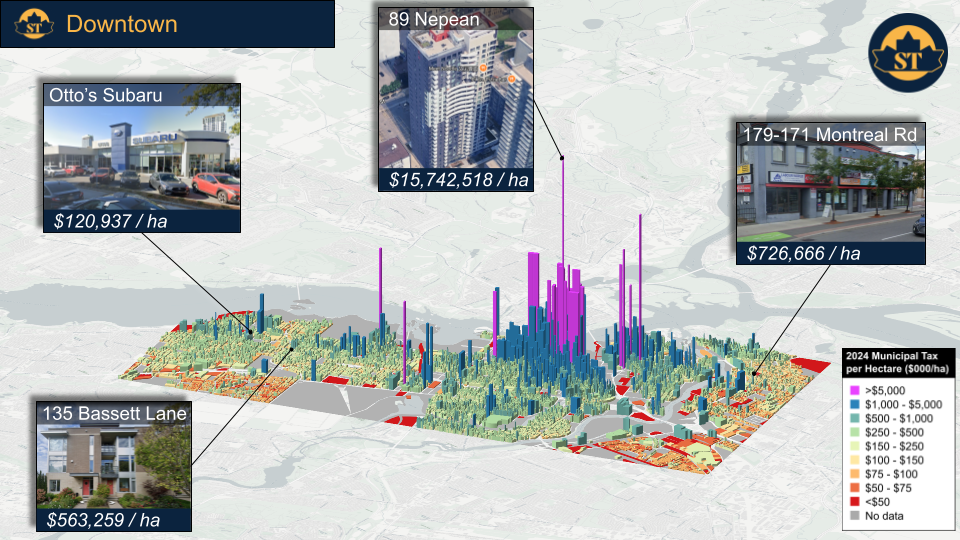
These data can also be rendered in 3D, like Urban 3. Here is the revenue density for all properties within the City of Ottawa’s urban boundary. It’s important to note that the height of these shapes do not represent building heights, but rather revenue density per property (did we really need to label downtown?).
Seeing the Effect of Development Patterns
We can zoom in and start appreciating where value is being generated. For example, the city-leading property generates revenue at a rate of $15,000,000 per hectare. We also see how a sidewalk facing strip mall in Rideau-Vanier and a modest 3-story townhome in Kitchissippi outperform a car dealership by several factors.
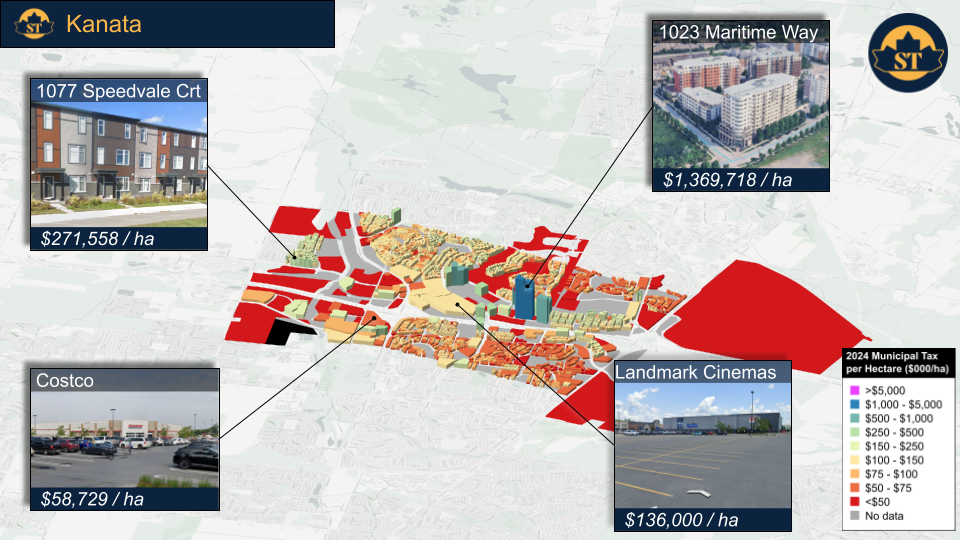
In the suburbs we see the same story. Large format car-centric businesses like Costco and Landmark Cinema’s are dwarfed in revenue density by townhomes and condos. From the data it seems clear that car-centric development patterns dilute the value of properties and erodes the city of wealth.
Sharing these data
We hope that these types of analyses can encourage pragmatic discussions between residents, community associations, city councillors and staff. To that end, Strong Towns Ottawa has a number of resources that we encourage you to use including the city wide property tax dataset. See the resources page